
Visualization Components
Reference to the Visualizations SDK components.
The Visualizations SDK contains a set of components that you can use to build a dashboard that matches your brand's look and feel:
- Visualizations
- Statements Chart
- Transactions Control
- Income Statements
- Credit Score
- Financial Ratios
- Bank Accounts
- Progress Bar
- Loading Indicator
- Error Image
Accounting Data as a Service™ Visualizations
The Visualizations component allows you to choose between Statements Chart, Transactions Control, Income Statements, Credit Score, Financial Ratios, Bank Accounts, Business Valuations components below based on the reportType parameter.
Use this component if you are not sure what component you need for your report type.
Examples
<railz-visualizations [configuration]='{
	"token": "your token..."
}' [filter]='{
	"startDate": "2021-03-01",
	"endDate": "2021-12-31",
	"businessName": "your business name...",
	"reportType": "bills",
	"serviceName": "sandbox"
}'></railz-visualizations>
<RailzVisualizations configuration={{
	"token": "your token..."
}} filter={{
	"startDate": "2021-03-01",
	"endDate": "2021-12-31",
	"businessName": "your business name...",
	"reportType": "bills",
	"serviceName": "sandbox"
}} />
<railz-visualizations configuration='{
	"token": "your token..."
}' filter='{
	"startDate": "2021-03-01",
	"endDate": "2021-12-31",
	"businessName": "your business name...",
	"reportType": "bills",
	"serviceName": "sandbox"
}'></railz-visualizations>
Web Component parameters should be strings and not an object.
Properties
See components properties for instructions on the specific properties you can use for each report type.
- Balance Sheets, Income Statements, Cashflow Statements: Statements Chart Properties
- Bills, Invoices: Transactions Control Properties
- Expenses, Revenue: Income Statements Properties
- Credit Score: Credit Score Properties
- Bank Accounts: Bank Accounts Properties
Statements Chart
The Statements Chart component is used to display a Stacked Bar line chart for balance sheets (balanceSheets), income statements (incomeStatements) and cashflow statements (cashflowStatements) based on the reportType parameter.
<railz-statements-chart [configuration]='{
	"token": "your token..."
}' [filter]='{
	"startDate": "2021-03-01",
	"endDate": "2021-12-31",
	"businessName": "your business name...",
	"reportType": "balanceSheets",
	"serviceName": "sandbox",
	"reportFrequency": "month"
}'></railz-statements-chart>
<RailzStatementsChart configuration={{
	"token": "your token..."
}} filter={{
	"startDate": "2021-03-01",
	"endDate": "2021-12-31",
	"reportFrequency": "month",
	"reportType": "balanceSheets",
	"businessName": "your business name...",
	"serviceName": "quickbooks"
}} />
<railz-statements-chart configuration='{
	"token": "your token..."
}' filter='{
	"startDate": "2021-03-01",
	"endDate": "2021-12-31",
	"businessName": "your business name...",
	"reportType": "balanceSheets",
	"serviceName": "sandbox",
	"reportFrequency": "month"
}'></railz-statements-chart>
Output

Statements chart component in Visualizations SDK. Click to Expand.
Customizations
<RailzStatementsChart configuration={{
	"token": "your token..."
}} filter={{
	"startDate": "2021-01-01",
	"endDate": "2021-12-31",
	"reportFrequency": "month",
	"reportType": "balanceSheets",
	"businessName": "your business name...",
	"serviceName": "sandbox"
}} options={{"container":{"style":{"border":0,"backgroundColor":"#000000","borderRadius":"20px","marginTop":"20px"}},"title":{"style":{"color":"#ffffff","justifyContent":"left","fontFamily":"Inter","fontSize":"24px"}},"chart":{"colors":["#ff0000","#ff6900","#d34000","#ff4545","#cccccc"],"fontFamily":"Inter","backgroundColor":"rgba(0,0,0,0.91)","label":{"fontFamily":"Inter","fontSize":"18px","color":"#ffffff"},"legend":{"itemStyle":{"fontFamily":"Inter","fontSize":"16px","color":"#cccccc"}}},"tooltipIndicator":{"fillColor":"#ffffff","width":"20px","height":"20px","tooltipTextStyle":{"color":"#ffffff","backgroundColor":"black"},"visible":true},"content":{"date":{"format":"yy","locale":"fr","prefix":"Quarter "},"tooltip":{"description":"Tooltip Customized"}}}} />
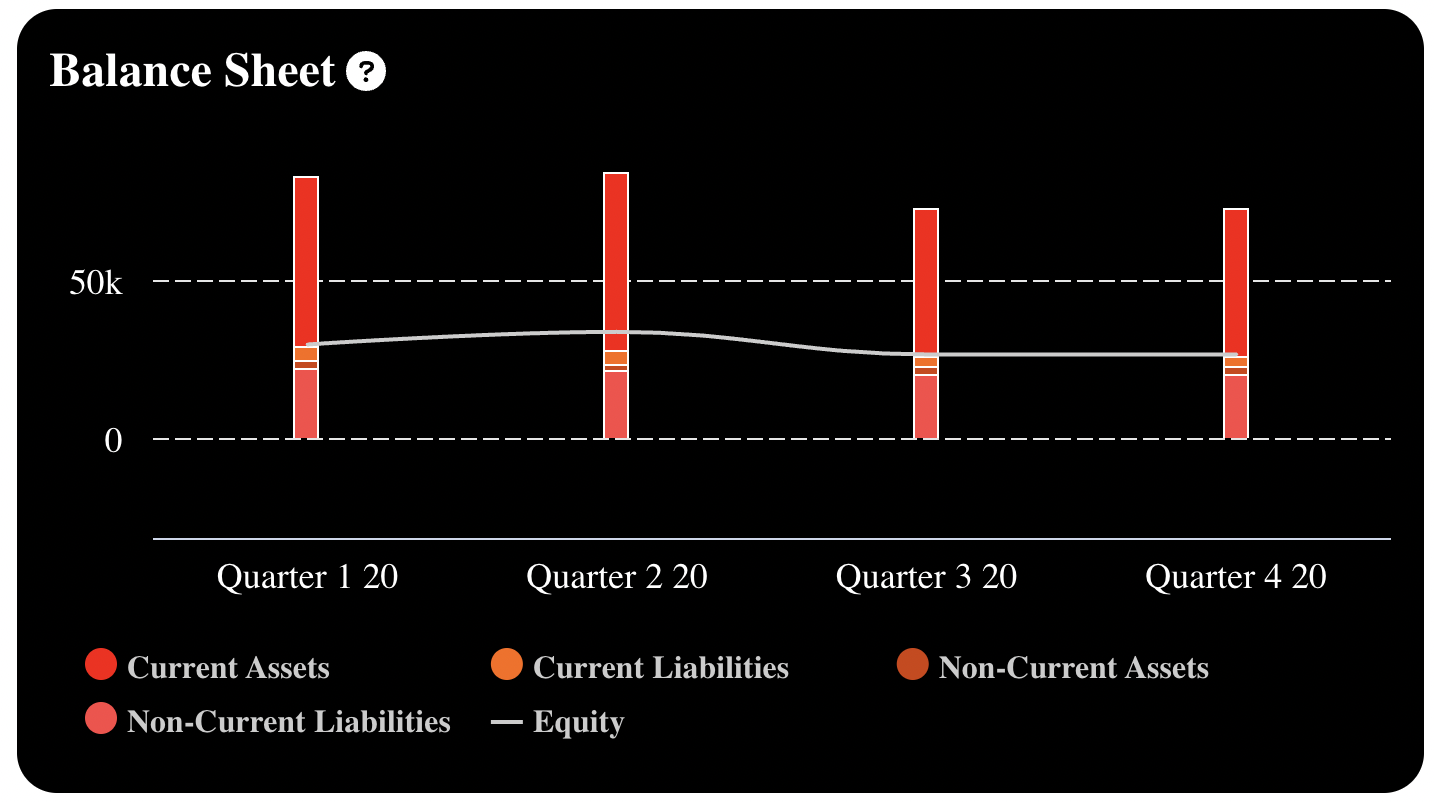
Statements Chart Component customized in Visualizations SDK. Click to Expand.
See Statements Chart component properties for instructions on the specific properties you can use.
Transactions Control
The Transactions Control component is used to display a Progress Control for invoices and bills based on the reportType parameter. It uses the Progress Bar component.
<railz-transactions-control [configuration]='{
	"token": "your token..."
}' [filter]='{
	"startDate": "2021-03-01",
	"endDate": "2021-12-31",
	"businessName": "your business name...",
	"reportType": "bills",
	"serviceName": "quickbooks"
}'></railz-transactions-control>
<RailzTransactionsControl configuration={{
	"token": "your token..."
}} filter={{
	"startDate": "2021-03-01",
	"endDate": "2021-12-31",
	"businessName": "your business name...",
	"reportType": "bills",
	"serviceName": "quickbooks"
}} />
<railz-transactions-control configuration='{
	"token": "your token..."
}' filter='{
	"startDate": "2021-03-01",
	"endDate": "2021-12-31",
	"businessName": "your business name...",
	"reportType": "bills",
	"serviceName": "sandbox"
}'></railz-transactions-control>
Output

Transactions Control Component in Visualizations SDK. Click to Expand.
Customizations
<RailzVisualizations configuration={{
	"token": "your token..."
}} filter={{
	"startDate": "2021-01-01",
	"endDate": "2022-01-01",
	"businessName": "your business name...",
	"reportType": "bills",
	"serviceName": "sandbox"
}} options={{"container":{"style":{"border":0,"backgroundColor":"black","borderRadius":"0"}},"title":{"style":{"color":"#cccccc","fontSize":"24px"},"text":"Balance Sheet"},"bar":{"titleStyle":{"color":"#ffffff"},"titleValueStyle":{"color":"#ffffff"},"subTitle1Style":{"color":"#ffffff"},"subTitleValue1Style":{"color":"#ffffff"},"subTitle2Style":{"color":"#ffffff"},"subTitleValue2Style":{"color":"#ffffff"},"barStyle":{"background":"#cdf8c4","borderRadius":"5px"},"progressStyle":{"background":"#2e6521","borderRadius":"5px"}},"loadingIndicator":{"fillColor":"#4DAE37", "textStyle":{color: "#4DAE37"}},"errorIndicator":{"fillColor":"#FF7575", "textStyle":{color: "#FF7575"}}}} />

Transactions Control Component customized in Visualizations SDK. Click to Expand.
See Transactions Control component properties for instructions on the specific properties you can use.
Income Statements
The Income Statements component is used to display a Pie Chart for therevenue and expenses based on the reportType parameter.
Examples
<railz-income-statements [configuration]='{
	"token": "your token..."
}' [filter]='{
	"startDate": "2021-03-01",
	"endDate": "2021-12-31",
	"businessName": "your business name...",
	"reportType": "expenses",
	"serviceName": "quickbooks",
	"reportFrequency": "month"
}'></railz-income-statements>
<RailzIncomeStatements configuration={{
	"token": "your token..."
}} filter={{
	"startDate": "2021-03-01",
	"endDate": "2021-12-31",
	"reportFrequency": "month",
	"reportType": "expenses",
	"businessName": "your business name...",
	"serviceName": "quickbooks"
}} />
<railz-income-statements configuration='{
	"token": "your token..."
}' filter='{
	"startDate": "2021-03-01",
	"endDate": "2021-12-31",
	"businessName": "your business name...",
	"reportType": "expenses",
	"serviceName": "quickbooks",
	"reportFrequency": "month"
}'></railz-income-statements>
Output

Income Statements Component in Visualizations SDK. Click to Expand.
Customizations
<railz-income-statements [configuration]='{
	"token": "your token..."
}' [filter]='{
	"startDate": "2021-03-01",
	"endDate": "2021-12-31",
	"businessName": "your business name...",
	"reportType": "expenses",
	"serviceName": "quickbooks",
	"reportFrequency": "month"
}' [options]='{"container":{"style":{"border":0,"backgroundColor":"#000000","borderRadius":"0"}},"title":{"style":{"color":"#ffffff","justifyContent":"center","fontFamily":"Inter","fontSize":"24px"}},"chart":{"colors":["#ff0000","#ff6900","#d34000","#ff4545","#cccccc"],"fontFamily":"Inter","backgroundColor":"rgba(0,0,0,0.91)","label":{"fontFamily":"Inter","fontSize":"18px","color":"#ffffff"},"legend":{"itemStyle":{"fontFamily":"Inter","fontSize":"16px","color":"#cccccc"}},"pie":{"total":{"color":"#ffffff","fontSize":"36px"},"legendName":{"color":"#ffffff","fontSize":"12px"},"legendValue":{"color":"#ffffff","fontSize":"12px"},"positive":{"color":"#259821","fontSize":"26px"},"negative":{"color":"#cc0000","fontSize":"26px"}}},"loadingIndicator":{"fillColor":"#ffffff","textStyle":{"color":"#ffffff","fontWeight":"bold"}},"errorIndicator":{"fillColor":"#FF7575","textStyle":{"color":"#ffffff","fontWeight":"bold"}},"tooltipIndicator":{"fillColor":"#ffffff","width":"20px","height":"20px","tooltipTextStyle":{"color":"#ffffff","backgroundColor":"black"},"visible":true},"content":{"title":"Your Expenses","tooltip":{"description":"Tooltip Customized"}}}' >
</railz-income-statements>
<RailzIncomeStatements configuration={{
	"token": "your token..."
}} filter={{
	"startDate": "2021-03-01",
	"endDate": "2021-12-31",
	"reportFrequency": "month",
	"reportType": "expenses",
	"businessName": "your business name...",
	"serviceName": "quickbooks"
}} options={{"container":{"style":{"border":0,"backgroundColor":"#000000","borderRadius":"0"}},"title":{"style":{"color":"#ffffff","justifyContent":"center","fontFamily":"Inter","fontSize":"24px"}},"chart":{"colors":["#ff0000","#ff6900","#d34000","#ff4545","#cccccc"],"fontFamily":"Inter","backgroundColor":"rgba(0,0,0,0.91)","label":{"fontFamily":"Inter","fontSize":"18px","color":"#ffffff"},"legend":{"itemStyle":{"fontFamily":"Inter","fontSize":"16px","color":"#cccccc"}},"pie":{"total":{"color":"#ffffff","fontSize":"36px"},"legendName":{"color":"#ffffff","fontSize":"12px"},"legendValue":{"color":"#ffffff","fontSize":"12px"},"positive":{"color":"#259821","fontSize":"26px"},"negative":{"color":"#cc0000","fontSize":"26px"}}},"loadingIndicator":{"fillColor":"#ffffff","textStyle":{"color":"#ffffff","fontWeight":"bold"}},"errorIndicator":{"fillColor":"#FF7575","textStyle":{"color":"#ffffff","fontWeight":"bold"}},"tooltipIndicator":{"fillColor":"#ffffff","width":"20px","height":"20px","tooltipTextStyle":{"color":"#ffffff","backgroundColor":"black"},"visible":true},"content":{"title":"Your Expenses","tooltip":{"description":"Tooltip Customized"}}}} />

Visualizations SDK - Income Statements Customized Component. Click to Expand.
See Income Statements Component Properties for instructions on the specific properties you can use.
Credit Score
The Credit Score component is used to display the credit score and rating for a business based on the endDate parameter.
Examples
<railz-credit-score [configuration]='{
	"token": "your token..."
}' [filter]='{
	"startDate": "2021-03-01",
	"endDate": "2021-12-31",
	"businessName": "your business name...",
	"reportType": "creditScore",
	"serviceName": "quickbooks"
}'></railz-credit-score>
<RailzCreditScore configuration={{
	"token": "your token..."
}} filter={{
	"startDate": "2021-03-01",
	"endDate": "2021-12-31",
	"businessName": "your business name...",
	"reportType": "railzScore",
	"serviceName": "quickbooks"
}} />
<railz-transactions-control configuration='{
	"token": "your token..."
}' filter='{
	"startDate": "2021-03-01",
	"endDate": "2021-12-31",
	"businessName": "your business name...",
	"reportType": "railzScore",
	"serviceName": "quickbooks"
}'></railz-transactions-control>
Output

Credit Score Component in Visualizations SDK. Click to Expand.
Customizations
<railz-credit-score [configuration]='{
	"token": "your token..."
}' [filter]='{
	"startDate": "2021-03-01",
	"endDate": "2021-12-31",
	"businessName": "your business name...",
	"reportType": "creditScore",
	"serviceName": "quickbooks"
}' [options]='{"container":{"style":{"backgroundColor":"#000000"}},"chart":{"backgroundColor":"#000000","gauge":{"score":{"color":"#ffffff"},"rating":{"color":"#ffffff"},"colorRanges":{"525":"#a91a1a","575":"#af3333","625":"#98623d","675":"#6DE18D","750":"#6DE18D","default":"red"}},"label":{"color":"#ffffff"}},"title":{"style":{"fontSize":"24px","justifyContent":"center","color":"#ffffff"}},"subTitle":{"style":{"fontSize":"14px","textAlign":"center","margin":0,"color":"#ffffff"},"position":"top","dateVisible":false},"loadingIndicator":{"fillColor":"#ffffff","textStyle":{"color":"#ffffff"}},"errorIndicator":{"fillColor":"#ffffff","textStyle":{"color":"#ffffff"}},"tooltipIndicator":{"fillColor":"#ffffff","width":"20px","height":"20px","tooltipTextStyle":{"color":"#ffffff","backgroundColor":"red"}},"content":{"title":"Your Credit Score","subTitle":"The result below is determined by your business data"}}' >
</railz-credit-score>
<RailzCreditScore configuration={{
	"token": "your token..."
}} filter={{
	"startDate": "2021-01-01",
	"endDate": "2022-01-01",
	"businessName": "your business name...",
	"reportType": "railzScore",
	"serviceName": "quickbooks"
}} options={{"container":{"style":{"backgroundColor":"#000000"}},"chart":{"backgroundColor":"#000000","gauge":{"score":{"color":"#ffffff"},"rating":{"color":"#ffffff"},"colorRanges":{"525":"#a91a1a","575":"#af3333","625":"#98623d","675":"#6DE18D","750":"#6DE18D","default":"red"}},"label":{"color":"#ffffff"}},"title":{"style":{"fontSize":"24px","justifyContent":"center","color":"#ffffff"}},"subTitle":{"style":{"fontSize":"14px","textAlign":"center","margin":0,"color":"#ffffff"},"position":"top","dateVisible":false},"loadingIndicator":{"fillColor":"#ffffff","textStyle":{"color":"#ffffff"}},"errorIndicator":{"fillColor":"#ffffff","textStyle":{"color":"#ffffff"}},"tooltipIndicator":{"fillColor":"#ffffff","width":"20px","height":"20px","tooltipTextStyle":{"color":"#ffffff","backgroundColor":"red"}},"content":{"title":"Your Credit Score","subTitle":"The result below is determined by your business data"}}} />

Credit Score Component customized in Visualizations SDK. Click to Expand.
See Credit Score component properties for instructions on the specific properties you can use.
Financial Ratios
The Financial Ratios component is used to display a list of financialRatios and their data over a period of time. It also shows the percentage change value if it exists.
Examples
<railz-financial-ratios [configuration]='{
	"token": "your token..."
}' [filter]='{
	"startDate": "2021-01-01",
	"endDate": "2021-12-31",
	"businessName": "your business name...",
	"reportType": "financialRatios",
	"serviceName": "quickbooks",
	"reportFrequency": "month"
}'></railz-financial-ratios>
<RailzFinancialRatios configuration={{
	"token": "your token..."
}} filter={{
	"startDate": "2021-01-01",
	"endDate": "2021-12-31",
	"reportFrequency": "month",
	"reportType": "financialRatios",
	"businessName": "your business name...",
	"serviceName": "quickbooks"
}} />
<railz-financial-ratios configuration='{
	"token": "your token..."
}' filter='{
	"startDate": "2021-01-01",
	"endDate": "2021-12-31",
	"businessName": "your business name...",
	"reportType": "financialRatios",
	"serviceName": "quickbooks",
	"reportFrequency": "month"
}'></railz-financial-ratios>
Output
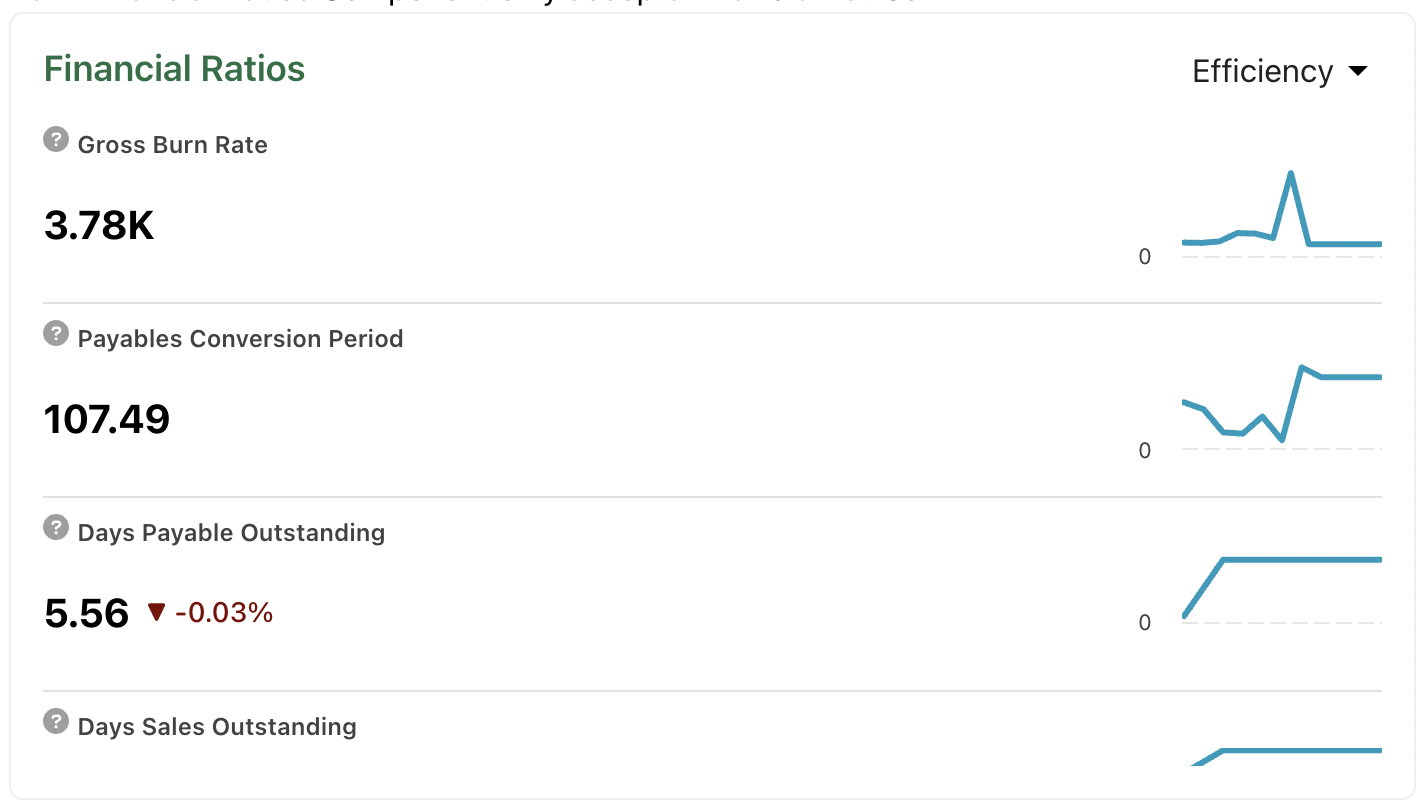
Financial Ratios Component in Visualizations SDK. Click to Expand.
Customizations
<railz-financial-ratios [configuration]='{
	"token": "your token..."
}' [filter]='{
	"startDate": "2021-01-01",
	"endDate": "2021-12-31",
	"businessName": "your business name...",
	"reportType": "financialRatios",
	"serviceName": "quickbooks",
	"reportFrequency": "month"
}' [options]='{"container":{"style":{"border":0,"backgroundColor":"#000000","borderRadius":"0"}},"title":{"style":{"color":"#ffffff","justifyContent":"center","fontFamily":"Inter","fontSize":"24px"}},"chart":{"colors":["#ff0000","#ff6900","#d34000","#ff4545","#cccccc"],"fontFamily":"Inter","backgroundColor":"rgba(0,0,0,0.91)","label":{"fontFamily":"Inter","fontSize":"18px","color":"#ffffff"},"legend":{"itemStyle":{"fontFamily":"Inter","fontSize":"16px","color":"#cccccc"}}},"ratio":{"header":{"flexDirection":"column"},"select":{"position":"center","container":{"background":"#5b5a5a"},"item":{"color":"white"},"selectedItem":{"color":"black","background":"white"},"style":{"background":"white","color":"black","padding":"10px","width":"30%","borderRadius":"10px","marginTop":"10px"}},"itemContainer":{"border":0,"borderRadius":"20px","boxShadow":"1px -1px 15px 5px #424242","color":"#ffffff","background":"#424242","marginTop":"20px","padding":"20px"},"itemToolTip":{"fillColor":"white"},"itemValue":{"color":"white"},"itemNameText":{"color":"white"},"itemPercentage":{"positive":{"color":"#92fa8f","fontSize":"26px"},"negative":{"color":"#ff6a6a","fontSize":"26px"}},"sparkLine":{"chart":{"backgroundColor":"#000000","colors":["#381da8"],"label":{"color":"#ffffff"},"yAxisStyle":{"gridLineColor":"#ffffff"},"style":{"borderRadius":"10px"}}}},"tooltipIndicator":{"fillColor":"#ffffff","width":"20px","height":"20px","tooltipTextStyle":{"color":"#ffffff","backgroundColor":"black"},"visible":true},"content":{"title":"Your Data Simplified","tooltip":{"description":"Tooltip Customized"}}}}' >
</railz-financial-ratios>
<RailzFinancialRatios configuration={{
	"token": "your token..."
}} filter={{
	"startDate": "2021-01-01",
	"endDate": "2021-12-31",
	"reportFrequency": "month",
	"reportType": "financialRatios",
	"businessName": "your business name...",
	"serviceName": "quickbooks"
}} options={{"container":{"style":{"border":0,"backgroundColor":"#000000","borderRadius":"0"}},"title":{"style":{"color":"#ffffff","justifyContent":"center","fontFamily":"Inter","fontSize":"24px"}},"chart":{"colors":["#ff0000","#ff6900","#d34000","#ff4545","#cccccc"],"fontFamily":"Inter","backgroundColor":"rgba(0,0,0,0.91)","label":{"fontFamily":"Inter","fontSize":"18px","color":"#ffffff"},"legend":{"itemStyle":{"fontFamily":"Inter","fontSize":"16px","color":"#cccccc"}}},"ratio":{"header":{"flexDirection":"column"},"select":{"position":"center","container":{"background":"#5b5a5a"},"item":{"color":"white"},"selectedItem":{"color":"black","background":"white"},"style":{"background":"white","color":"black","padding":"10px","width":"30%","borderRadius":"10px","marginTop":"10px"}},"itemContainer":{"border":0,"borderRadius":"20px","boxShadow":"1px -1px 15px 5px #424242","color":"#ffffff","background":"#424242","marginTop":"20px","padding":"20px"},"itemToolTip":{"fillColor":"white"},"itemValue":{"color":"white"},"itemNameText":{"color":"white"},"itemPercentage":{"positive":{"color":"#92fa8f","fontSize":"26px"},"negative":{"color":"#ff6a6a","fontSize":"26px"}},"sparkLine":{"chart":{"backgroundColor":"#000000","colors":["#381da8"],"label":{"color":"#ffffff"},"yAxisStyle":{"gridLineColor":"#ffffff"},"style":{"borderRadius":"10px"}}}},"tooltipIndicator":{"fillColor":"#ffffff","width":"20px","height":"20px","tooltipTextStyle":{"color":"#ffffff","backgroundColor":"black"},"visible":true},"content":{"title":"Your Data Simplified","tooltip":{"description":"Tooltip Customized"}}}} />
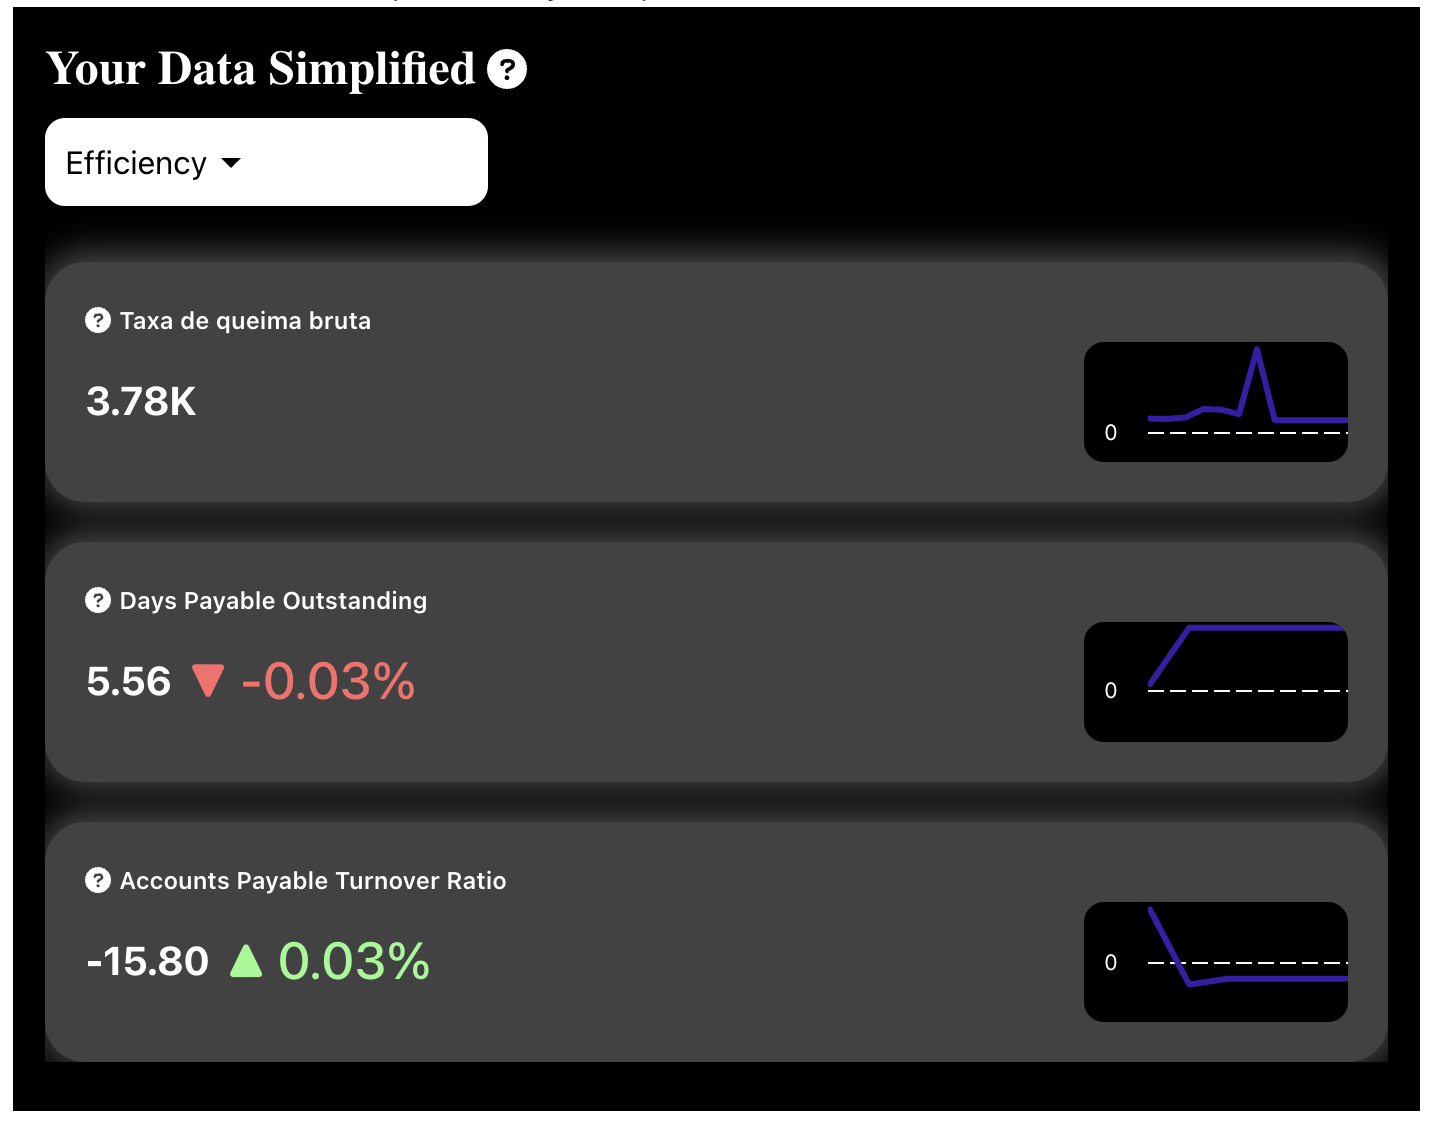
Financial Ratios Component customized in Visualizations SDK. Click to Expand.
See Financial Ratios Component Properties for instructions on the specific properties you can use.
Bank Accounts
The Bank Accounts component is used to display a list of bankAccounts a business has and data related to it.
Examples
<railz-bank-accounts [configuration]='{
	"token": "your token..."
}' [filter]='{
	"businessName": "your business name...",
	"reportType": "bankAccounts",
	"serviceName": "quickbooks"
}'></railz-bank-accounts>
<RailzBankAccounts configuration={{
	"token": "your token..."
}} filter={{
	"reportType": "bankAccounts",
	"businessName": "your business name...",
	"serviceName": "quickbooks"
}} />
<railz-bank-accounts configuration='{
	"token": "your token..."
}' filter='{
	"businessName": "your business name...",
	"reportType": "bankAccounts",
	"serviceName": "quickbooks",
}'></railz-bank-accounts>
Output
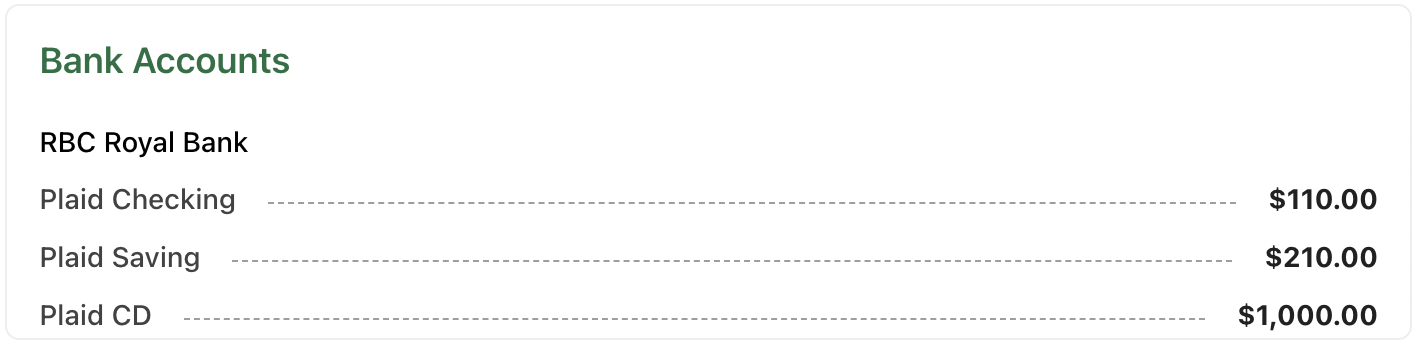
Bank Accounts Component in Visualizations SDK. Click to Expand.
Customizations
<railz-bank-accounts [configuration]='{
	"token": "your token..."
}' [filter]='{
	"businessName": "your business name...",
	"reportType": "bankAccounts",
	"serviceName": "quickbooks"
}' [options]='{"container":{"style":{"border":0,"backgroundColor":"#000000","borderRadius":"0"}},"title":{"style":{"color":"#ffffff","justifyContent":"center","fontFamily":"Inter","fontSize":"24px"}},"table":{"style":{"padding":"30px"},"title":{"color":"white","fontSize":"30px","marginBottom":"16px"},"itemName":{"fontSize":"16px","color":"white"},"itemSeperator":{"display":"none"},"itemValue":{"color":"#94b9ff","fontSize":"20px"}},"tooltipIndicator":{"fillColor":"#ffffff","width":"20px","height":"20px","tooltipTextStyle":{"color":"#ffffff","backgroundColor":"black"},"visible":true},"content":{"title":"Account Balance","tooltip":{"description":"Tooltip Customized"}}}' >
</railz-bank-accounts>
<RailzBankAccounts configuration={{
	"token": "your token..."
}} filter={{
	"reportType": "bankAccounts",
	"businessName": "your business name...",
	"serviceName": "quickbooks"
}} options={{"container":{"style":{"border":0,"backgroundColor":"#000000","borderRadius":"0"}},"title":{"style":{"color":"#ffffff","justifyContent":"center","fontFamily":"Inter","fontSize":"24px"}},"table":{"style":{"padding":"30px"},"title":{"color":"white","fontSize":"30px","marginBottom":"16px"},"itemName":{"fontSize":"16px","color":"white"},"itemSeperator":{"display":"none"},"itemValue":{"color":"#94b9ff","fontSize":"20px"}},"tooltipIndicator":{"fillColor":"#ffffff","width":"20px","height":"20px","tooltipTextStyle":{"color":"#ffffff","backgroundColor":"black"},"visible":true},"content":{"title":"Account Balance","tooltip":{"description":"Tooltip Customized"}}}} />
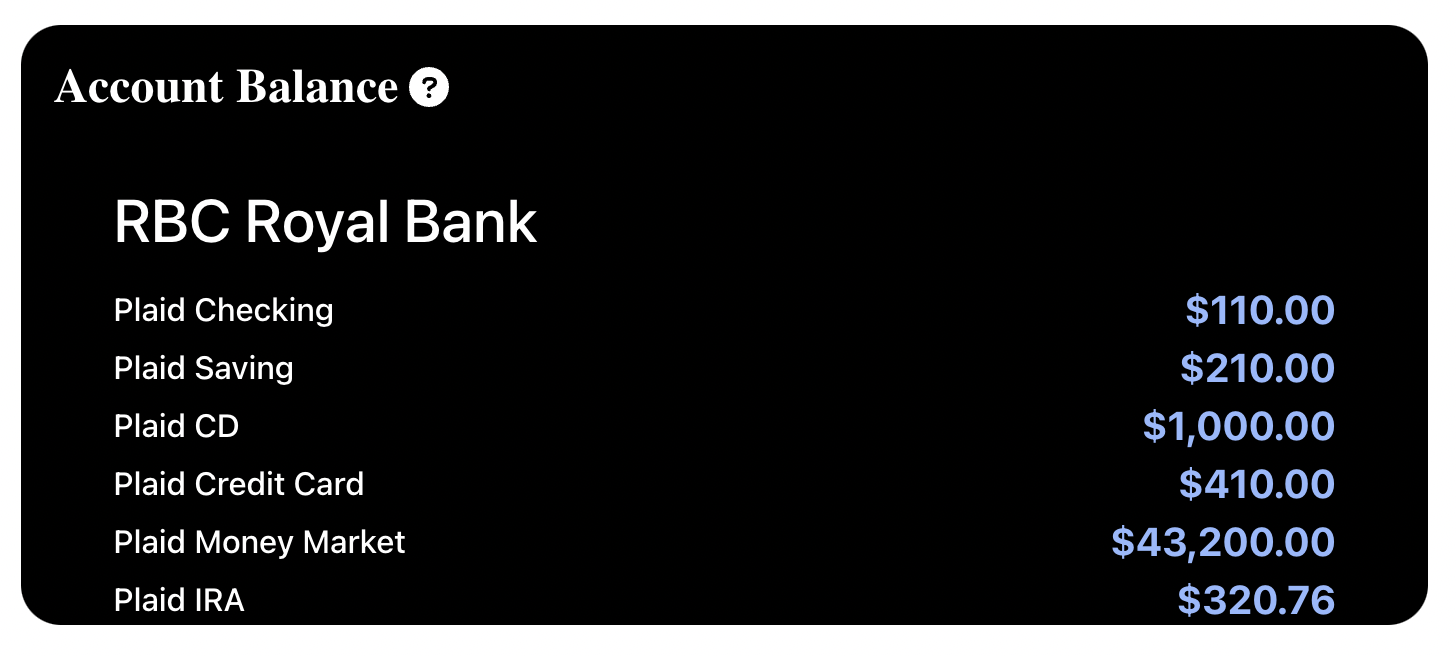
Bank Accounts Component customized in Visualizations SDK. Click to Expand.
See Bank Accounts Component Properties for instructions on the specific properties you can use.
Business Valuations
The Business Valuation component is used to display a list of businessValuations ....
Examples
<RailzBusinessValuations
    configuration={{
        "token": "your token..."
    }}
    filter={{
    "startDate": "2021-03-01",
    "endDate": "2021-12-31",
    "reportType": "businessValuations",
    "connectionUuid": “CON-uuid”,
    "reportFrequency": "month”,
     }}
 />
<railz-business-valuations [configuration]='{
  "token": "your token..."
}' [filter]='{
  "startDate": "2021-03-01",
  "endDate": "2021-12-31",
  "reportType": "businessValuations",
  "connectionUuid": “CON-uuid”,
  "reportFrequency": "month”,
}'></railz-business-valuations>
<railz-business-valuations configuration='{
  "token": "your token..."
}' filter='{
  "startDate": "2021-03-01",
  "endDate": "2021-12-31",
  "reportType": "businessValuations",
  "connectionUuid": “CON-uuid”,
  "reportFrequency": "month”,
}'></railz-business-valuations >
Output

Progress Bar
The Progress Bar component is used to visualize the progress of a transaction, it can be modified to fit your needs.
Examples
<railz-progress-bar reportType="invoices"
  [overdueAmount]="2000" [unpaidAmount]="12000" [paidAmount]="15000"></railz-progress-bar>
<RailzProgressBar reportType="invoices"
  unpaidAmount={15000} paidAmount={15000} overdueAmount={12000}/>
<railz-progress-bar reportType="invoices"
  overdueAmount="2000" unpaidAmount="12000" paidAmount="15000"></railz-progress-bar>
Output

Progress Bar component in Visualizations SDK. Click to Expand.
See Progress Bar component properties for instructions on the specific properties you can use.
Loading Indicator
The Loading Indicator component is a set of basic loading animations that indicates the processing progress.
<railz-loading></railz-loading>
<RailzLoading/>
<railz-loading></railz-loading>
Output
Customizations
Include your Custom Text
<railz-loading loadingText="Loading Data"></railz-loading>
Include your Custom Style
<RailzLoading loadingText="Loading..." fillColor="red" textStyle={{color: "red"}} />
See Loading Indicator component properties for instructions on the specific properties you can use.
Error Image
The Error Image component is used to show an image indicator based on HTTP response codes. See response codes for more details.
Examples
<railz-error-image [statusCode]="202"></railz-error-image>
<RailzErrorImage statusCode={202}/>
<railz-error-image statusCode="202"></railz-error-image>
Output
Customizations
Change Text and Icon Color
<railz-error-image
     statusCode="404"
     fillColor="red"
     textStyle="{'color': 'red'}">
</railz-error-image>
Display Icon Only
<railz-error-image
     statusCode="202"
     width="170"
     height="150"
     text="">
</railz-error-image>
See Error Image component properties for instructions on the specific properties you can use.
Updated over 1 year ago