Quickstart & Example Apps
Learn how to include Accounting Data as a Service™ Visualizations into your web applications with ease.
This quickstart is specifically meant for developers. It will take you through the basic steps required to install the Visualizations SDK. You should have gone through the Quickstart for Developers and Authentication pages before proceeding with this quickstart.
This QuickStart is specifically using the Sandbox environments.
We've built a set of quickstart and example outputs to get you to incorporate the Visualizations into your application fast and with ease. Start by cloning the quickstart examples and running the Visualizations on your local machine. If you don't need an example, you can skip to installing the Visualization SDK in React and Angular. You'll need API keys, which you can get by signing up for an account through our Dashboard.
Once you have your API keys (client_id and secret_key), you'll need to:
- Clone Visualizations GitHub repository.
- Update your environment configuration with the API keys.
- Build and run your application to display your first chart.
Prerequisites
Before getting started, make sure you have Node.js and npm installed. Windows users should make sure they have a terminal capable of performing basic Unix shell commands.
Quickstart Example Apps Setup
1. Clone the Visualizations GitHub Repository.
# clone the repository
git clone https://github.com/railz-ai/railz-visualizations.git
cd examples/nodejs
2. Update your Environment File
This step is important to ensure you are able to authenticate and generate an access token. See details about Authentication here.
Copy the .env.example file to .env, then fill out RAILZ_AUTH_URL, RAILZ_CLIENT_ID and RAILZ_CLIENT_SECRET in .env
# Copy the .env.example file to .env, then fill
# out RAILZ_AUTH_URL, RAILZ_CLIENT_ID and RAILZ_CLIENT_SECRET in .env
cp .env.example .env
3. Build and Run Example Backend App
Install dependencies and start the example backend app. Your backend server will be running at http://localhost:4000.
# install dependencies and Start the backend app
yarn server

# Server should run at http://localhost:4000
4. Start a Frontend Server
We currently have examples in Angular and React which you can choose from:
- Your Angular frontend server will be running at http://localhost:4200.
- Your React frontend server will be running at http://localhost:3000.
# start the angular frontend app
yarn angular

# Server should run at http://localhost:4200
# start the react frontend app
yarn react

# Server should run at http://localhost:3000
5. Display your First Chart
You may now display your first chart after starting the examples. To display a chart, you'll need access to your current business names, which should be available in the Dashboard or via the GET /businesses API endpoint.
After launching the quickstart app on localhost, you'll need to:
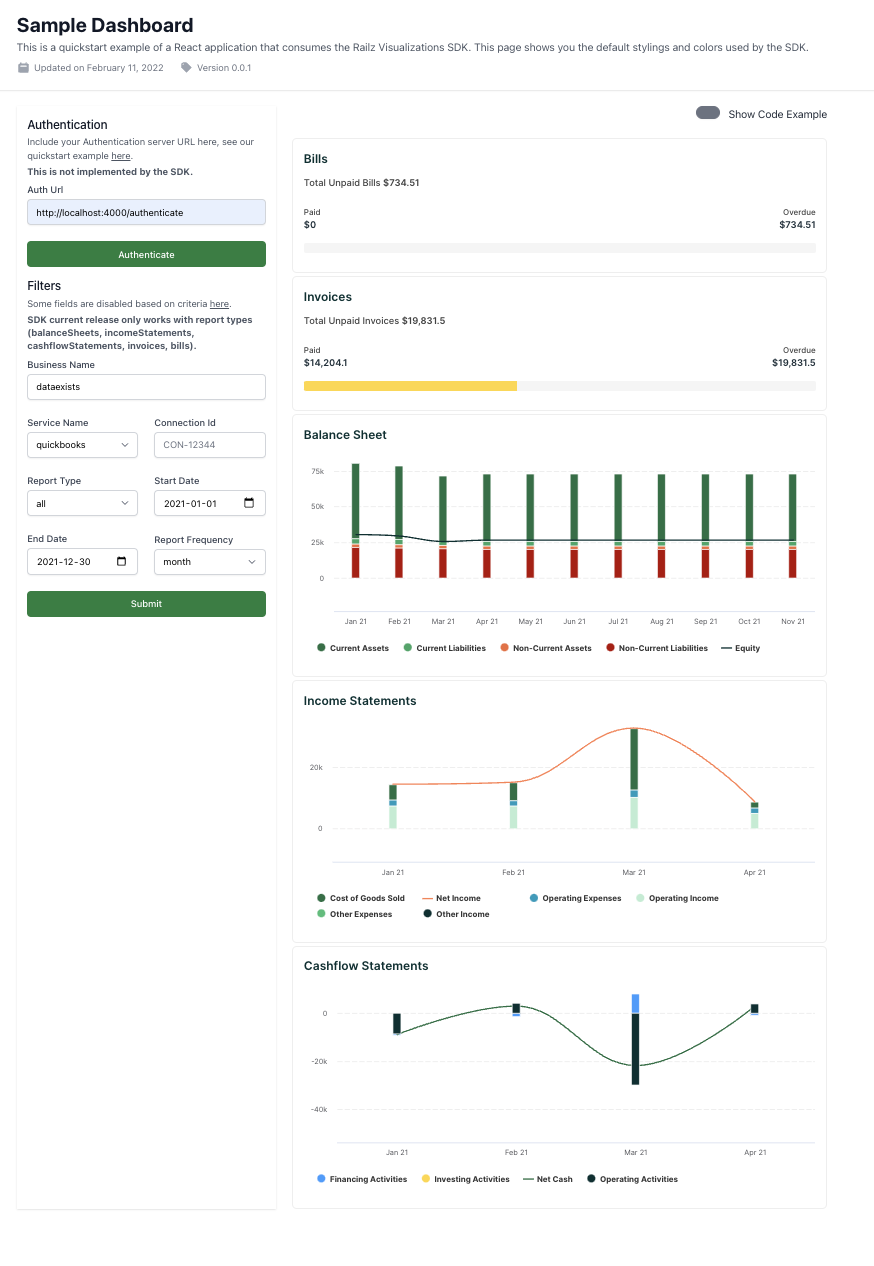
- Provide your local backend server URL in the Authentication section of the Basic page's input field. To get an access token, use the 'https://localhost:4000/authenticate' path and then click Authenticate.
- In the Filters section, input a Business Name from your sandbox environment, choose sandbox as the Service Provider, Balance Sheet as the Report Type, and a Start and End Date with a Monthly Report Frequency, then click Submit.
- The loading indicator should appear at this stage, followed by the balance sheets chart. You can experiment with the other filter choices and the other pages for customizations and reusable components.
️
The all option in the Report Type field is not an acceptable parameter by the SDK.

Accounting Data as a Service™ Visualizations SDK quickstart sample application. Click to Expand.
How Does It Work?
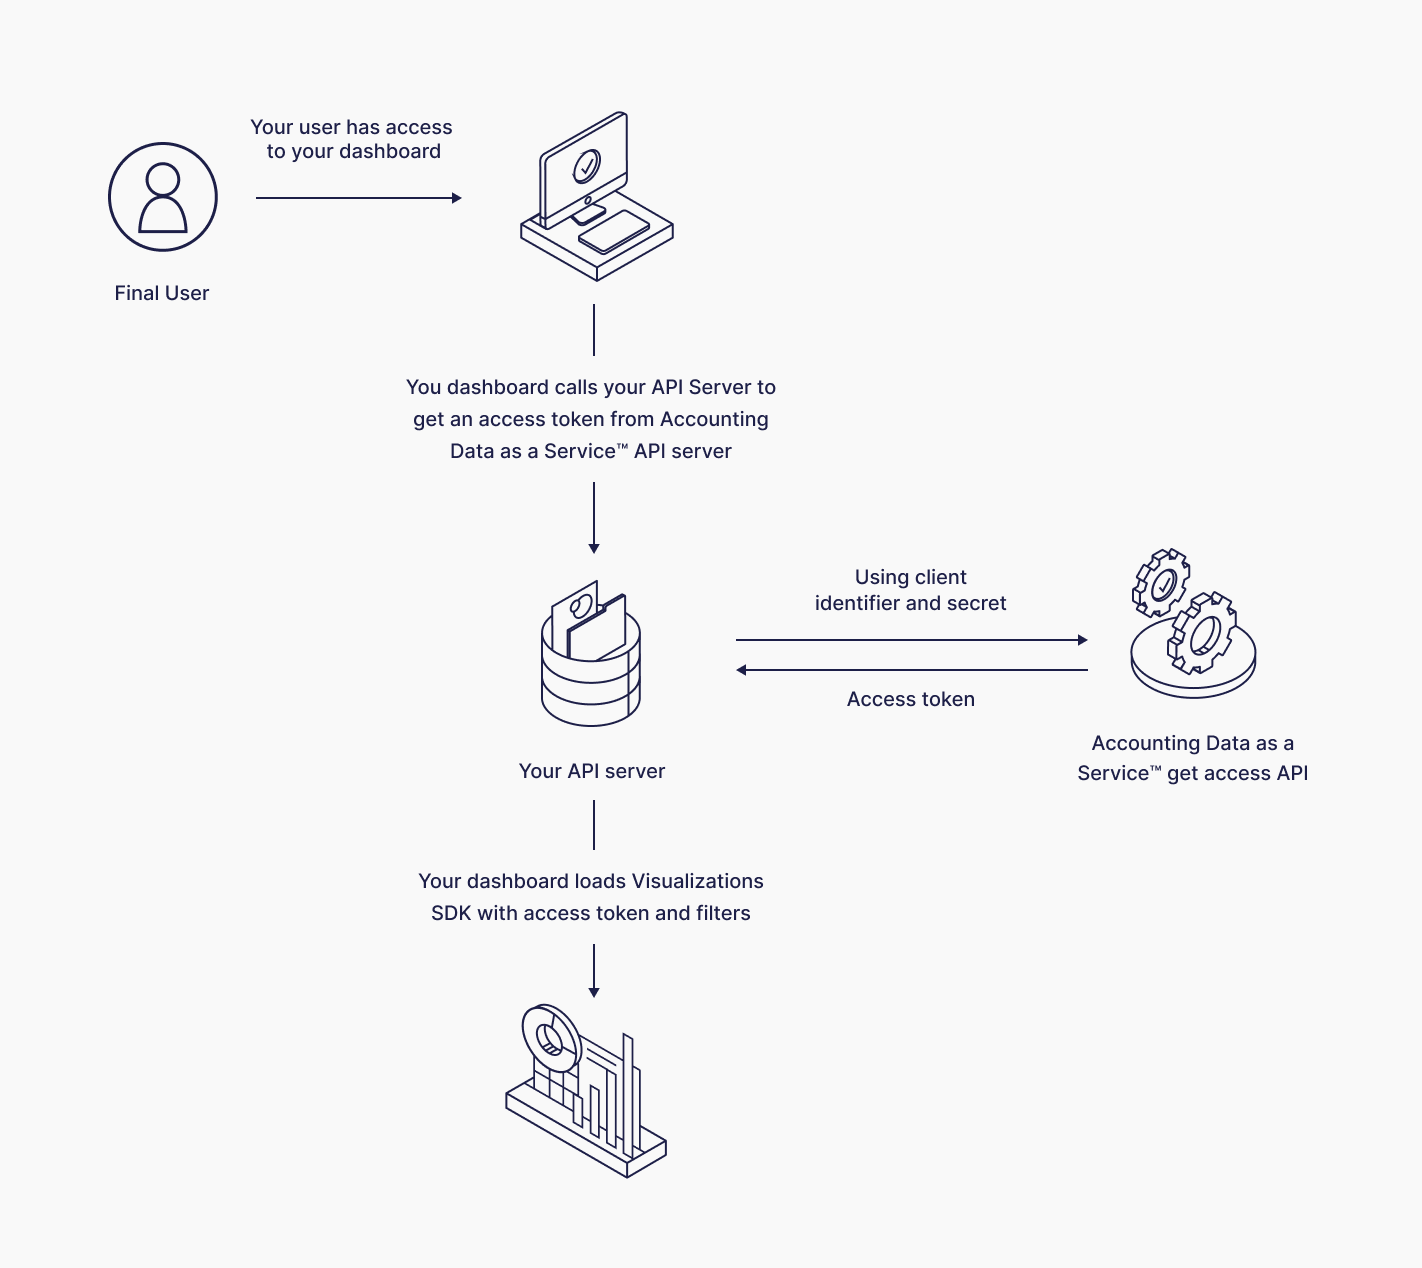
The Visualizations SDK requires both a server and a client-side component. As described in the quickstart installation above, you will need to:
- Use our /getAccess API endpoint to obtain an access token.
- Display the Visualizations component together with your filters and the access token.

Visualizations SDK auth flow. Click to Expand.
Updated over 1 year ago
Learn to install the Visualizations SDK in React and Angular.